Instrumenting Ruby on Rails with TraceView in under 10 minutes
Update May 14, 2013: AppNeta now offers free tracing for single projects. Check it out on their pricing page.
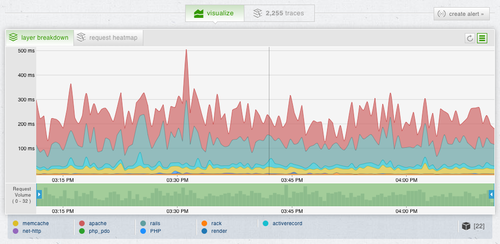
TraceView by AppNeta provides deep performance monitoring of web applications.
It gives you insight into your web application performance such as this:
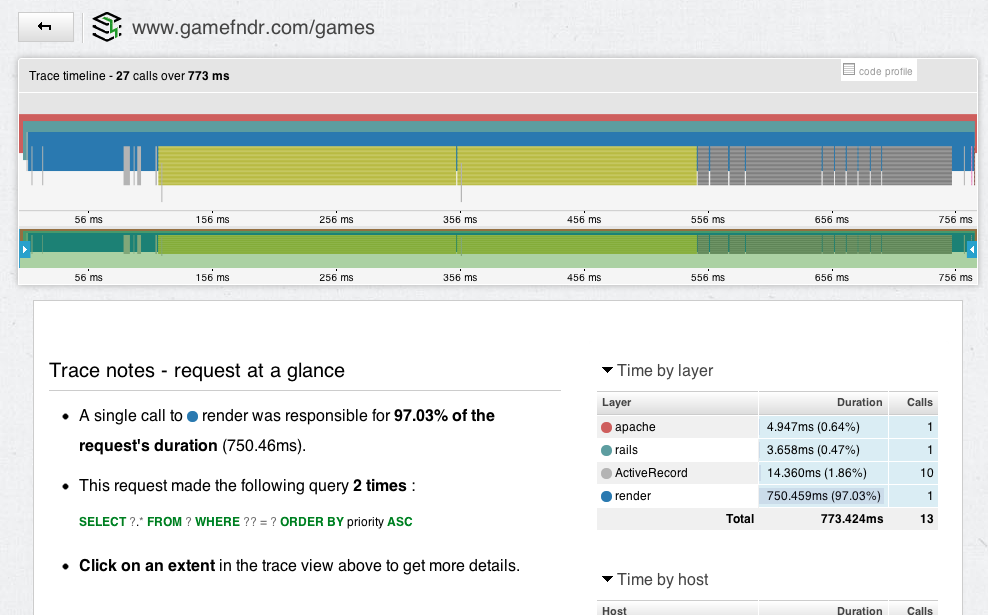
and a per request drill-down that shows you the nitty gritty detail of where time is spent in individual requests (full-size):
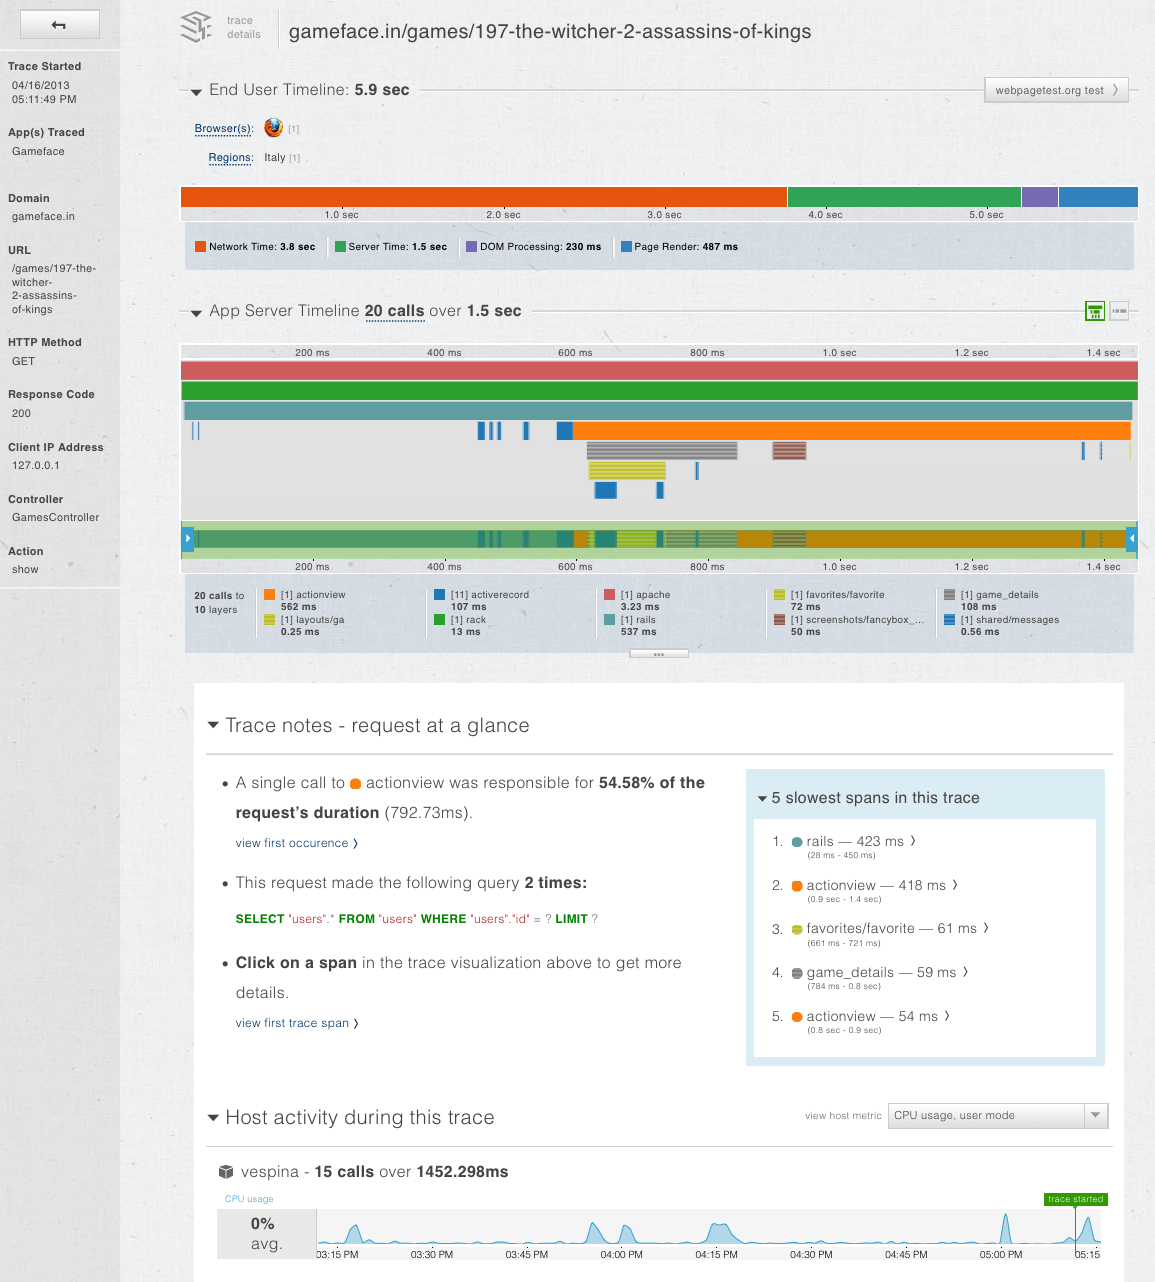
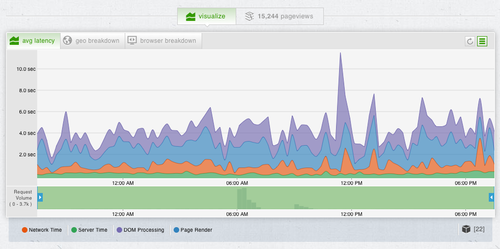
and even end-user monitoring:
I run it on Gameface and Password Pusher - it’s an essential tool in identifying problem areas, performance bottlenecks and simply poor performing code. (Read: ActionView)
Installation
Installing TraceView consists of two parts:
- installing the system daemon on your host
- installing the Ruby gem in your application.
Why a system daemon? TraceView uses a system daemon to collect instrumentation from sources beyond application code such as host metrics, Apache or Resque.
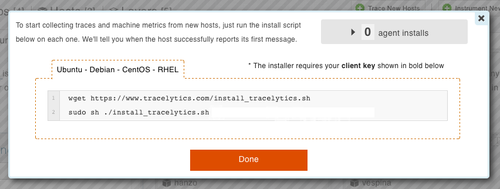
The system daemon is installed with two commands that can be pasted into your shell. An account specific version of these commands are available in your TraceView dashboard once you create an account. (Under Settings; App Configuration; Trace New Hosts)
And the gem for your application Gemfile available on RubyGems:
gem 'oboe'
Setup
TraceView functions by sampling a subset of all requests that go through your web application. This sample rate must be set at the entry point of requests in your application. This can be a load balancer, Apache/nginx or Ruby itself. Successive hosts and software stacks that requests pass through will act appropriately according to upstream settings.
Yes. That means requests can be traced across hosts, software stacks even track internal API calls via HTTP/SOAP/REST which make for spectacular application insight. But that’s another post for another time.
For this walkthrough we’re going to assume that you’re running a Ruby on Rails application with Unicorn, Thin, Puma or any other Rack based Ruby webserver.
To instead configure Apache/nginx as the entry point, see here.
Ruby as the Entry Point
If you setup Apache or nginx as your entry point then you can skip this part entirely. The oboe gem will take it’s tracing instructions from upstream automatically.
When the oboe gem is installed in your application, it makes available Oboe::Config which is a nested hash of configuration options that affect how your application is instrumented.
Luckily, the defaults are very smart and only a couple initial values need to be configured.
The two required values are:
Oboe::Config[:tracing_mode] = 'always'
Oboe::config[:sample_rate] = 100000  # 10% of incoming requests
These values enable tracing (:tracing_mode) and sets the sample rate to 10% (:sample_rate). The sample_rate is calculated by the value out of one million. e.g. 300000 would equal a 30% sample rate meaning 3 out of 10 requests would be sampled. (For low traffic sites, you may want to set these values higher.)
These values are usually set in a Rails initializer for Ruby on Rails. See the Optional Rails Initializer section on this page. A complete list of all configuration options for Oboe::Config is here.
Getting Performance Data
And that’s it. Now to the good stuff.
If you want to test that the oboe gem is functional, start-up a Rails console, you should see a message to stdout similar to:
Tracelytics oboe gem 1.4.0.2 successfully loaded.
Note that on hosts that don’t have the system daemon installed, the oboe gem disables itself and outputs a message to that fact.
Unsupported Tracelytics environment (no libs). Going No-op.
Deploy/restart your application and you should start seeing traces show up in your TraceView dashboard after a couple minutes.
Summary
Installation and setup of TraceView for your application is a simple two step process that can be done in 10 minutes or less. Traceview gives a unique in-depth view into requests even as they cross hosts and software stacks.
Things are moving fast for the Ruby language instrumentation in TraceView. We already support tracing of memcache-client, memcached, dalli, mongo, moped, mongoid, mongomapper, cassandra, ActiveRecord (postgres, mysql, mysql2) plus more. Most recently we added support for Rack and Resque tracing. For a full-list of supported libraries, see the top of this article.
If you haven’t tried out TraceView yet, give it a run. You won’t be disappointed.
Extras: Some Random Chart Porn
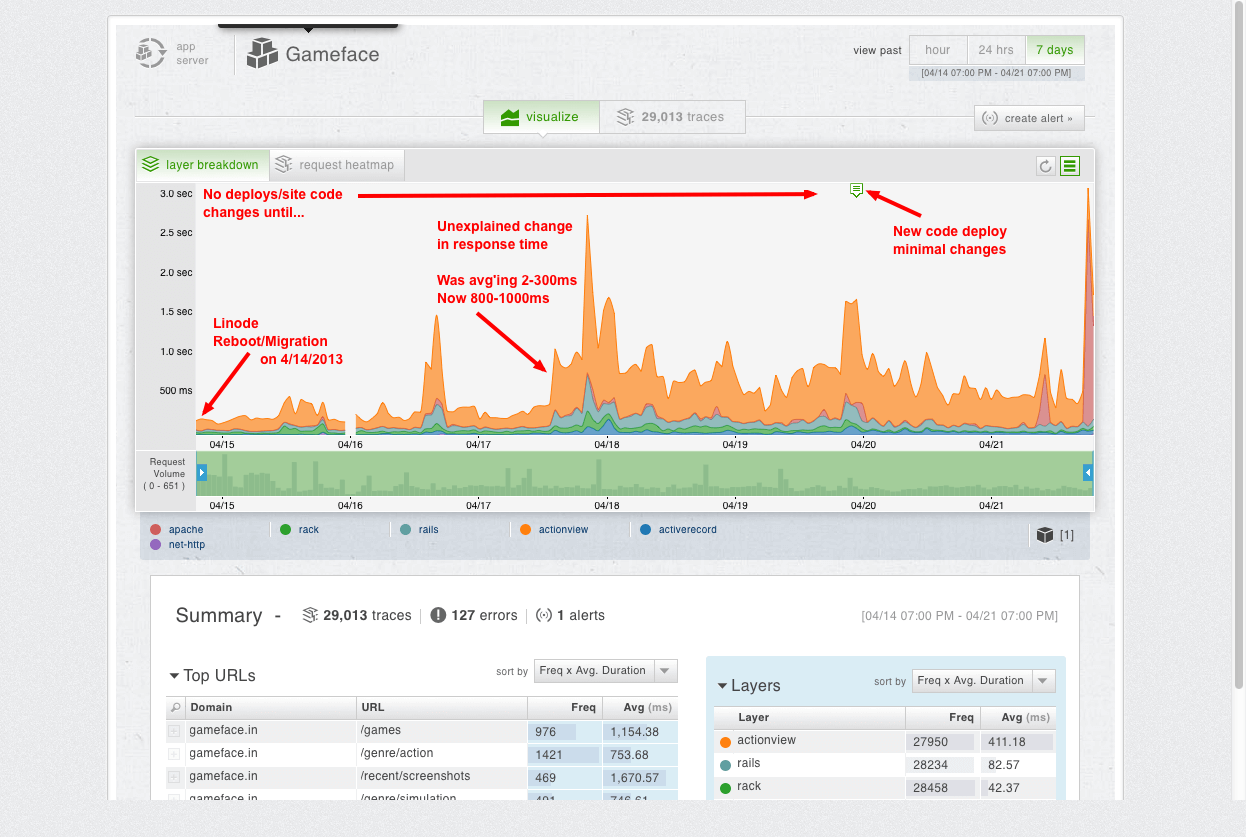
A screenshot that I sent to Linode when performance unexpectedly dropped:
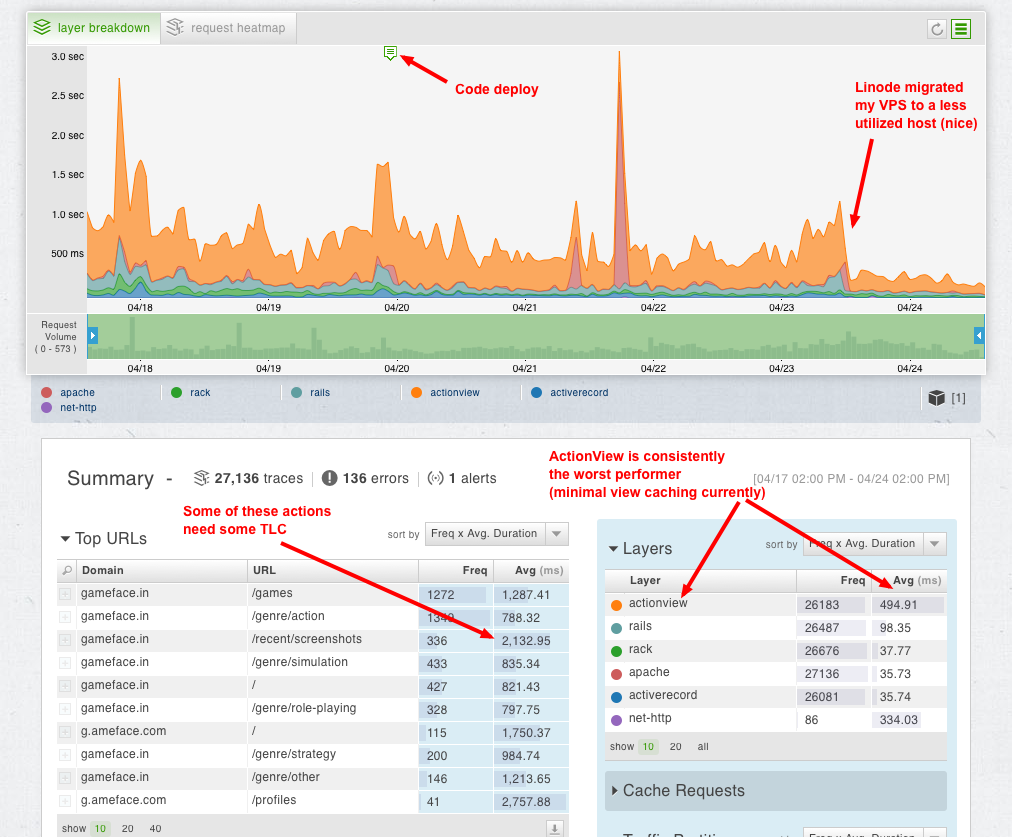
Linode migrated my VPS to a lesser utilized host with evident results (Thanks Linode):
An older issue that Gameface had with atrocious rendering times: